


So we’re at Election Eve. I posted the 538 charts for 2020 and 2016, not necessarily to say that Nate Silver is “right” (though I think he’s broadly right here) but rather to show how different the dynamics of 2016 were than today.
Why did the 2016 election look like a sine wave, or a rubber band snapping back to near-even?
Simple: Both candidates were extremely unpopular. Polling showed HRC taking a lead when Trump did or said something terrible. But the race kept returning to the mean because HRC was consistently unpopular too. That meant a very high number of undecideds late in the contest. So-called “double haters” broke heavily for Trump in the end – perhaps because of the Comey letter, perhaps because they thought HRC would win anyway. They were, first and foremost, anti-HRC. So the only question was if they’d vote at all, vote 3rd party, or for Trump. There were other polling issues – especially failure to weight by education (which caused major misses in the Rust Belt).
But many aggregators that said “HRC has a 99% chance of winning!” never looked at vote SHARE (how close was HRC to 50). They looked at vote MARGIN. A 44-38 lead is much less meaningful than a 50-44 lead. Fewer undecideds can throw the result off. Another problem – and this is one I personally fell for – was a “dead cat bounce” in the last two days of polling. I thought it meant late breakers going to HRC. Turns out it was mostly herding by some prominent national pollsters – even though state polls did NOT show a late move to Clinton.
Anyway, 2020 is a completely different story.
Joe Biden has maintained high favorables even as the campaign has gone along. His approach to the pandemic is completely different than Trump’s, and voters rate that issue as #1 or #2 in their list of priorities. Anemic 3rd party support means it’s less likely to see a fracturing of anti-Trump voters. There are much fewer undecideds so Biden is over 50. Biden’s national popular vote margin AND share is far stronger than Clinton’s.
Needless to say, I think Biden is heavily favored to win. But I got 2016 wrong and I should mention how 2020 could go wrong too. It’s all about Pennsylvania. Biden wins PA, he gets MI and WI and the HRC states. And that wins. There is a LOT more polling in PA than in 2016 and it is pretty consistent about a 5-7 point Biden lead, with Biden’s share from 49-53 and Trump’s from 42-46. In any other year we would call that a safe Biden lead. Hell, it’s better than Obama’s 2012 polling lead in PA (he won it by just over 5). BUT, we have PTSD from 2016 and need to consider how PA could go wrong.
A lot of it has to do with turnout – or rather, ballot spoilage for those who turned out. And I don’t mean rural, non-college white turnout. I expect that to be through the roof as it was in 2016. But PA has never had early or non-excuse vote-by-mail before. So there are bound to be mistakes in submitting mail ballots. PA Dems have done a good job educating voters about the “naked ballot” issue (putting it in the inner sleeve). And courts have allowed ballots sent ON E-Day to count if they arrive by Friday. FWIW, I’m not as bothered by Trump declaring victory prematurely or by courts throwing out huge numbers of mail ballots. But voter error is a real possibility, though probably not enough to decide the outcome.
The other “Trump can win” scenario boils down to a theory advanced by a few unusual pollsters who think there is a large number of “shy” Trump voters who won’t tell pollsters how they really feel. This “social desirability bias” supposedly lowers Trump’s margins as Trump voters are afraid of telling a pollster how they really feel. Evidence for this is very thin, however. (And yes, Trump supporters are not shy). One pollster – Trafalgar – has produced results that suggest a fairly uniform 6-point swing from the polling mean to Trump. He has never revealed how he calculates his “social desirability bonus,” and I suspect it’s mostly just made up. Rarely does he release internals and crosstabs of his polls. The few times he did, the results were laughable (like Trump getting ~40% of the black vote). They DID get PA and MI correct in 2016 but also horribly missed TX and GA in 2018. His theory probably works only when there is a major right-leaning shift in that year. Otherwise it’s wishcasting. In fact, pollsters would have gotten WI, MI and PA much closer to right if they weighted by education. Remaining undecideds would have accounted for the rest. That said, if “all the polls are wrong” and Trump out-performs his numbers this year, a lot of the explanation will be these “missing” Trump voters.
But that’s a way of accounting for how the 10% possibility (per 538) can come true. A 90% chance of winning per 538 is very different than a 72% chance. ]
I’m not doing an Electoral College state by state forecast this year. But I’ll post other thoughts later today, esp. about early voting and turnout.
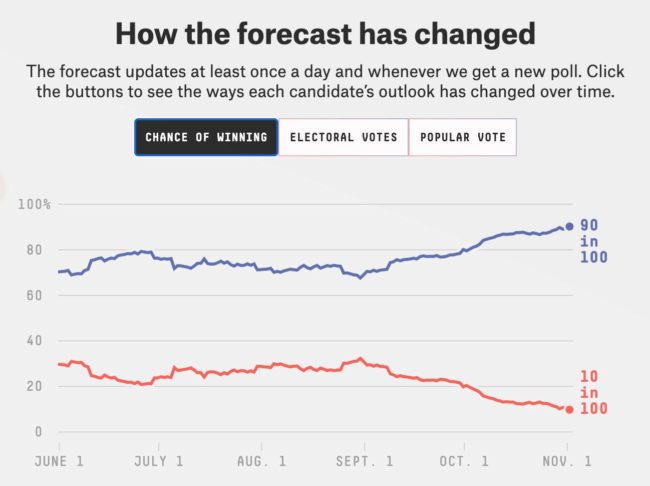
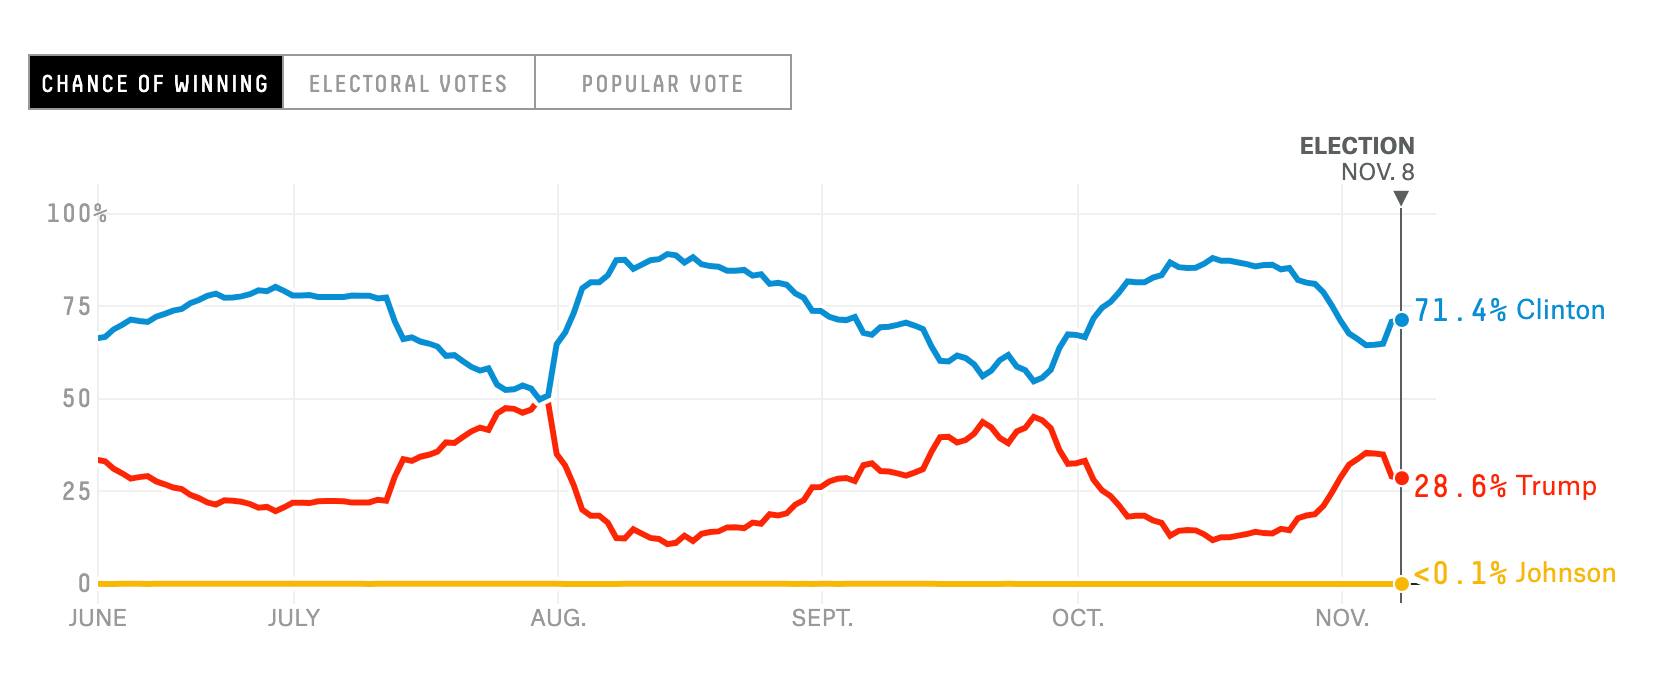
Illustration 182602171 © Viktoriia Yatskina – Dreamstime.com